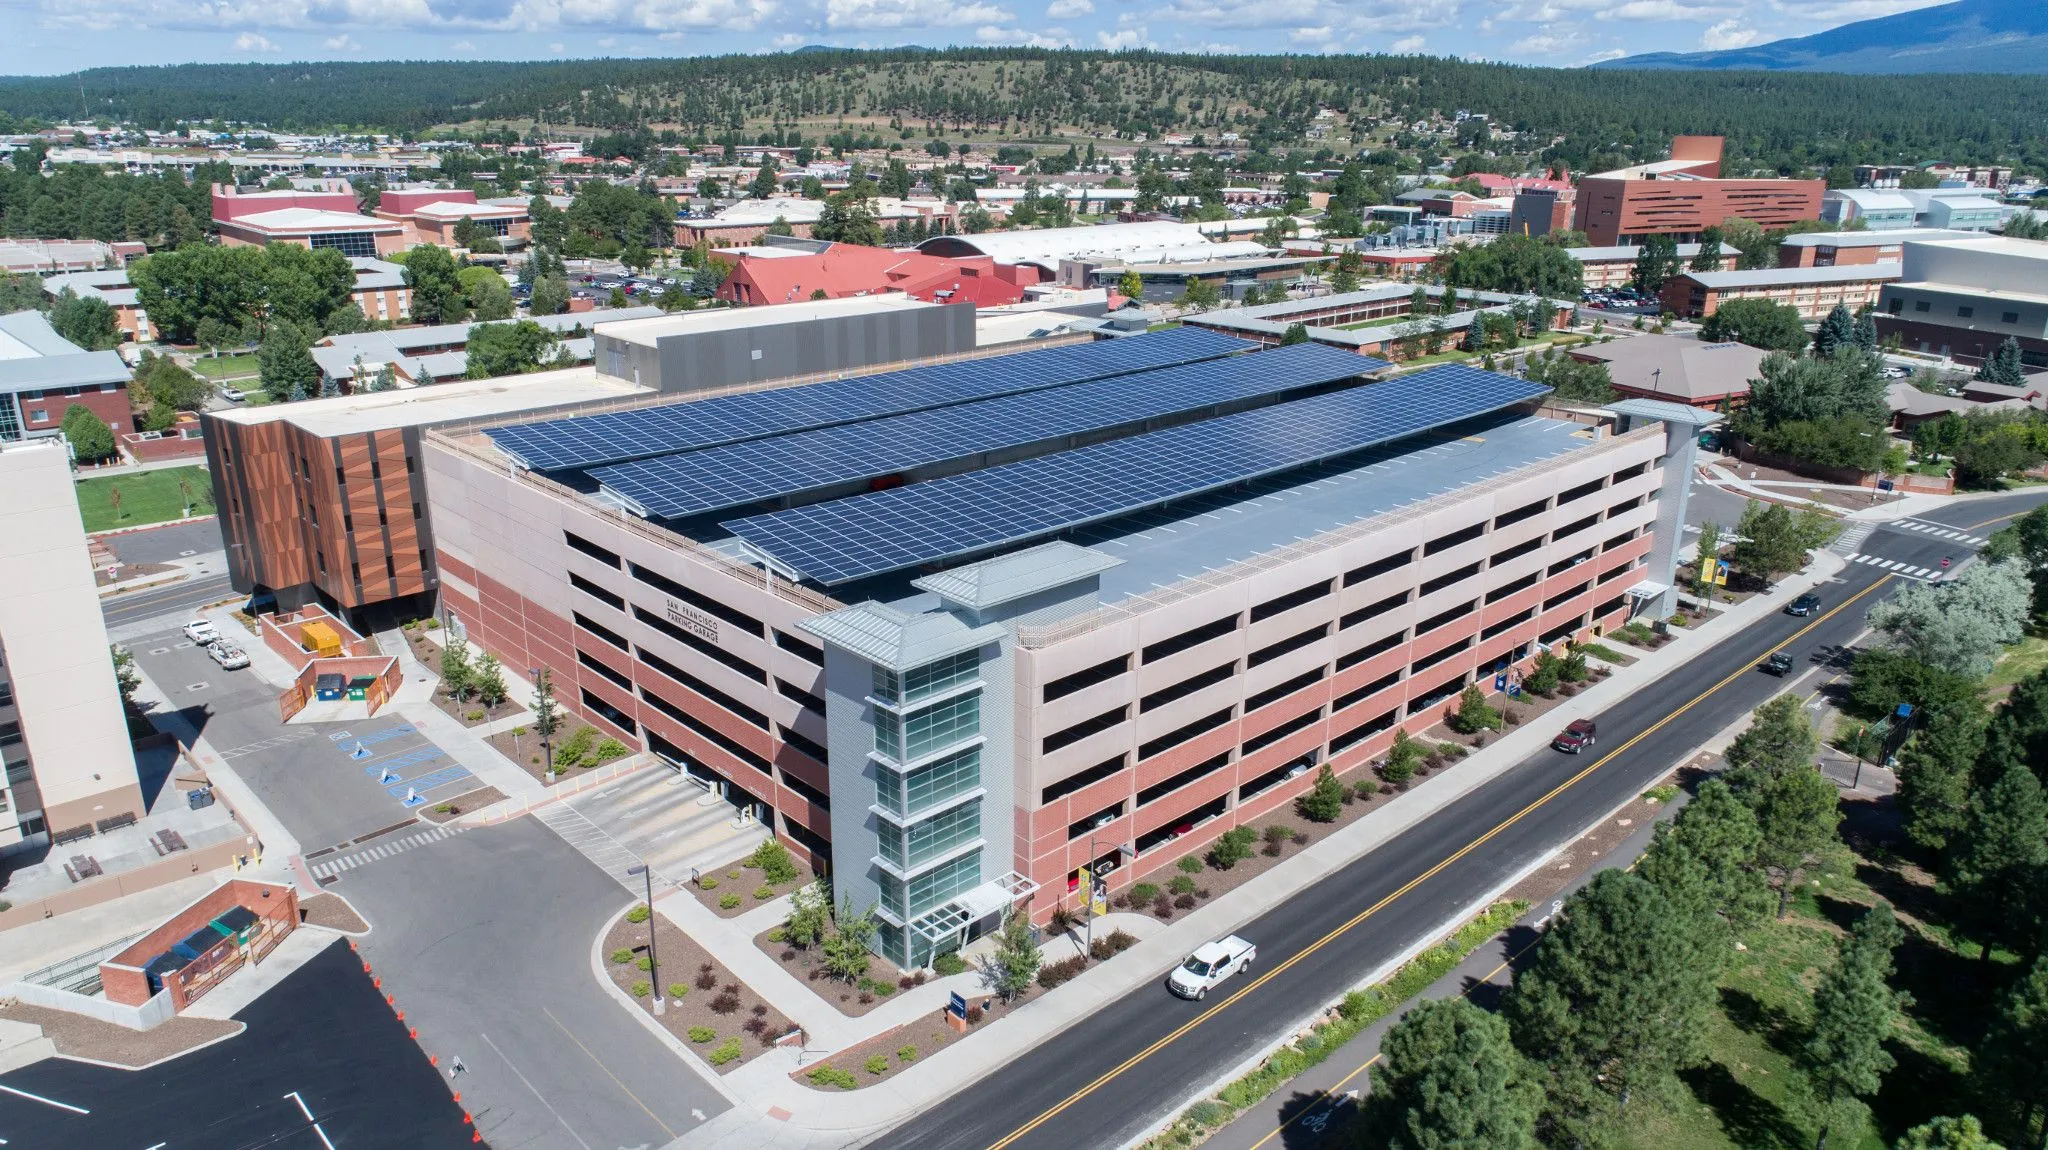
Photo: Northern Arizona University
San Francisco Garage Solar Array
A 25-year cash flow model of the 556 kW solar carport on NAU's San Francisco Street parking garage. The Green Fund's 10-year commitment ends this year, and the array returns a $270K net present value at a 6% discount rate.
The solar array on top of NAU’s San Francisco Street parking garage is a 556 kWdc carport system. It was financed through a power purchase agreement (PPA) with Ameresco, with the student-funded Green Fund paying down the PPA’s fixed fee over the first ten years.
I built a 25-year discounted cash flow model from the PPA, the Green Fund’s memorandum of understanding (MOU), nearly eight years of metered production, and NAU’s APS utility bills from 2017 to 2026. At a 6% hurdle rate, the project’s NPV is $270,231. The ten-year funding block is now complete, so the array moves from a net cost to a net saving.
- $270KNet present value at 6%
- 15.5 yrsPayback period
- 10.1%Internal rate of return
- $0Upfront capital from the university
How the deal is structured
- The PPA. NAU buys the array’s power from Ameresco at a flat $0.044/kWh with no escalation for 25 years. The PPA also charges a fixed $100,000 a year for the first ten years of operation.
- The Green Fund’s share. The Green Fund committed $1,000,000, paid as $100,000 a year for ten years to cover that fixed fee. The university put up no capital.
- The savings split. The MOU between the Green Fund and the NAU president says that once the project is paid for, utility savings are split 50/50 between the University Budget Office and the Sustainability Revolving Fund. All ten payments have now been made, so the split starts this year (Year 11).
Does the array perform as promised?
I compared metered production from November 2018 through September 2026 against plane-of-array irradiance to check the model’s generation assumptions.
- It produces more than the contract assumed. The PPA estimated 779,124 kWh in Year 1. Averaged month by month across all the data, the array produces 873,256 kWh a year, about 12% higher.
- It shows little degradation. Output tracks irradiance closely, with no sign of losses from inverter clipping or soiling beyond the standard 0.5% a year.
+12% over the contract's assumption
The cash flow model
The project makes money through rate arbitrage. NAU pays $0.044/kWh for solar power instead of buying the same power from APS at retail rates that keep rising. Solar output peaks in late spring and summer, so I weighted each month’s APS rate by how much the array produces that month. On that basis, NAU’s rate rose from $0.0859/kWh in 2017 to $0.1203/kWh in 2026, a 4.99% compound annual rate.
The model starts from the 873,256 kWh production average and takes off 0.5% a year for degradation. Years 1 to 10 use the actual weighted APS rates. Year 11 applies the approved 23% APS rate increase, which takes the rate to $0.148/kWh, and from Year 12 the rate grows 4.99% a year. Each year’s net cash flow is the avoided APS cost, minus the PPA energy cost, minus the $100,000 fee in Years 1 to 10.
| Metric | Result |
|---|---|
| 25-year net cash flow | $1,470,131 |
| NPV at 6% | $270,231 |
| Payback period | 15.5 years |
| IRR | 10.09% |
Discounted total, in the money Discounted total, behind Undiscounted total
Three phases, one turning point
The Green Fund’s $1M went in as a $100,000 yearly operating payment, not a Year 0 investment, so a standard upfront-capital IRR doesn’t apply. The 10.09% treats the losses in Years 1 to 10 as the investment and the surpluses in Years 11 to 25 as the return.
- Years 1 to 10: a net loss each year. The avoided APS cost didn’t cover both the energy payments and the $100,000 fee. By Year 10 the cumulative loss reached $548,758.
- Year 11 (this year): the fee ends and the 23% APS increase takes effect, so the array nets $86,384. The 50/50 split starts, and the Sustainability Revolving Fund gets $43,192.
- Years 12 to 25: as APS rates keep rising, the gap between the grid price and the fixed $0.044 widens. The fund’s half grows to $96,263 a year by Year 25.
Sensitivity
The $270K figure depends on two assumptions: how fast APS raises rates, and how fast the panels wear out. I tested both.
NPV rises almost in a straight line with APS rate growth. At 2% a year, less than half the historical pace, NPV is still $120,599. At 8% a year, it reaches $462,255.
Rate growth and panel wear together
- Faster wear doesn’t sink it. At 1.0% annual degradation, double the standard rate, NPV is still $206,730 at the historical rate growth. Every cell in the table is positive.
- The fee schedule is why. The $100,000 fee disappears in Year 11, so the later years, when panels wear most, carry no fixed cost. That leaves a large margin before wear can push the project underwater.
| Degradation ↓ / Rate growth → | 2.00% | 3.50% | 4.99% | 6.50% | 8.00% |
|---|---|---|---|---|---|
| 0.25% | $147K−$123K vs base case | $221K−$49K vs base case | $304K+$34K vs base case | $399K+$129K vs base case | $506K+$235K vs base case |
| 0.50% | $121K−$150K vs base case | $191K−$79K vs base case | $270KBase case | $361K+$90K vs base case | $462K+$192K vs base case |
| 0.75% | $95K−$175K vs base case | $163K−$108K vs base case | $238K−$32K vs base case | $324K+$54K vs base case | $421K+$150K vs base case |
| 1.00% | $71K−$199K vs base case | $135K−$135K vs base case | $207K−$64K vs base case | $289K+$18K vs base case | $381K+$110K vs base case |
| 1.50% | $25K−$245K vs base case | $83K−$187K vs base case | $148K−$122K vs base case | $222K−$48K vs base case | $306K+$35K vs base case |
Below the base case Base case Above the base case
What this means for future projects
- No capital budget needed. Turning a $1M contribution into ten yearly payments that match a PPA fee let the project go ahead without any upfront university spending.
- A hedge on power prices. A flat $0.044/kWh for 25 years protects NAU from APS rate increases. The wider the gap grows, the more the array saves.
- A fund that refills itself. The MOU’s 50/50 split sends half the savings back to the Sustainability Revolving Fund from this year on, which can pay for the next projects.
Methodology
Sources. The PPA with Ameresco (signed October 31, 2016) for the 556.38 kWdc system, the Green Fund MOU (signed April 2015, later amended to $1,000,000), hourly and monthly production from the site’s Veris C3 meter (November 2018 to September 2026), and NAU’s monthly APS billing ledger (January 2017 to August 2026).
Production baseline. 2018 and 2026 are partial years, so I averaged production by calendar month across every year of data and added up the twelve monthly averages. That gives 873,256 kWh, the Year 1 production in the model, reduced by 0.5% each year after. Monthly shares range from 4.18% of the year in December to 12.29% in May.
Utility rate. The avoided cost is what NAU would have paid APS for the same power. For each year from 2017 to 2026, I weighted the monthly APS rates by the array’s monthly production shares, since a plain average understates what summer solar output saves. September to December 2026 use the current $0.120/kWh rate. The 4.99% growth rate comes from that 2017 to 2026 series. Year 11 adds the approved 23% rate increase, and the rate reaches $0.2927/kWh by Year 25.
Cash flow and NPV. For each year: avoided APS cost (production × APS rate), minus PPA energy cost (production × $0.044), minus the fixed fee ($100,000 in Years 1 to 10, $0 after). Year 0 outflow is $0. Cash flows are discounted at 6%.
Savings split. The model treats the project as “paid for” when the tenth $100,000 payment is made, and from Year 11 on assigns 50% of each year’s surplus to the Sustainability Revolving Fund.